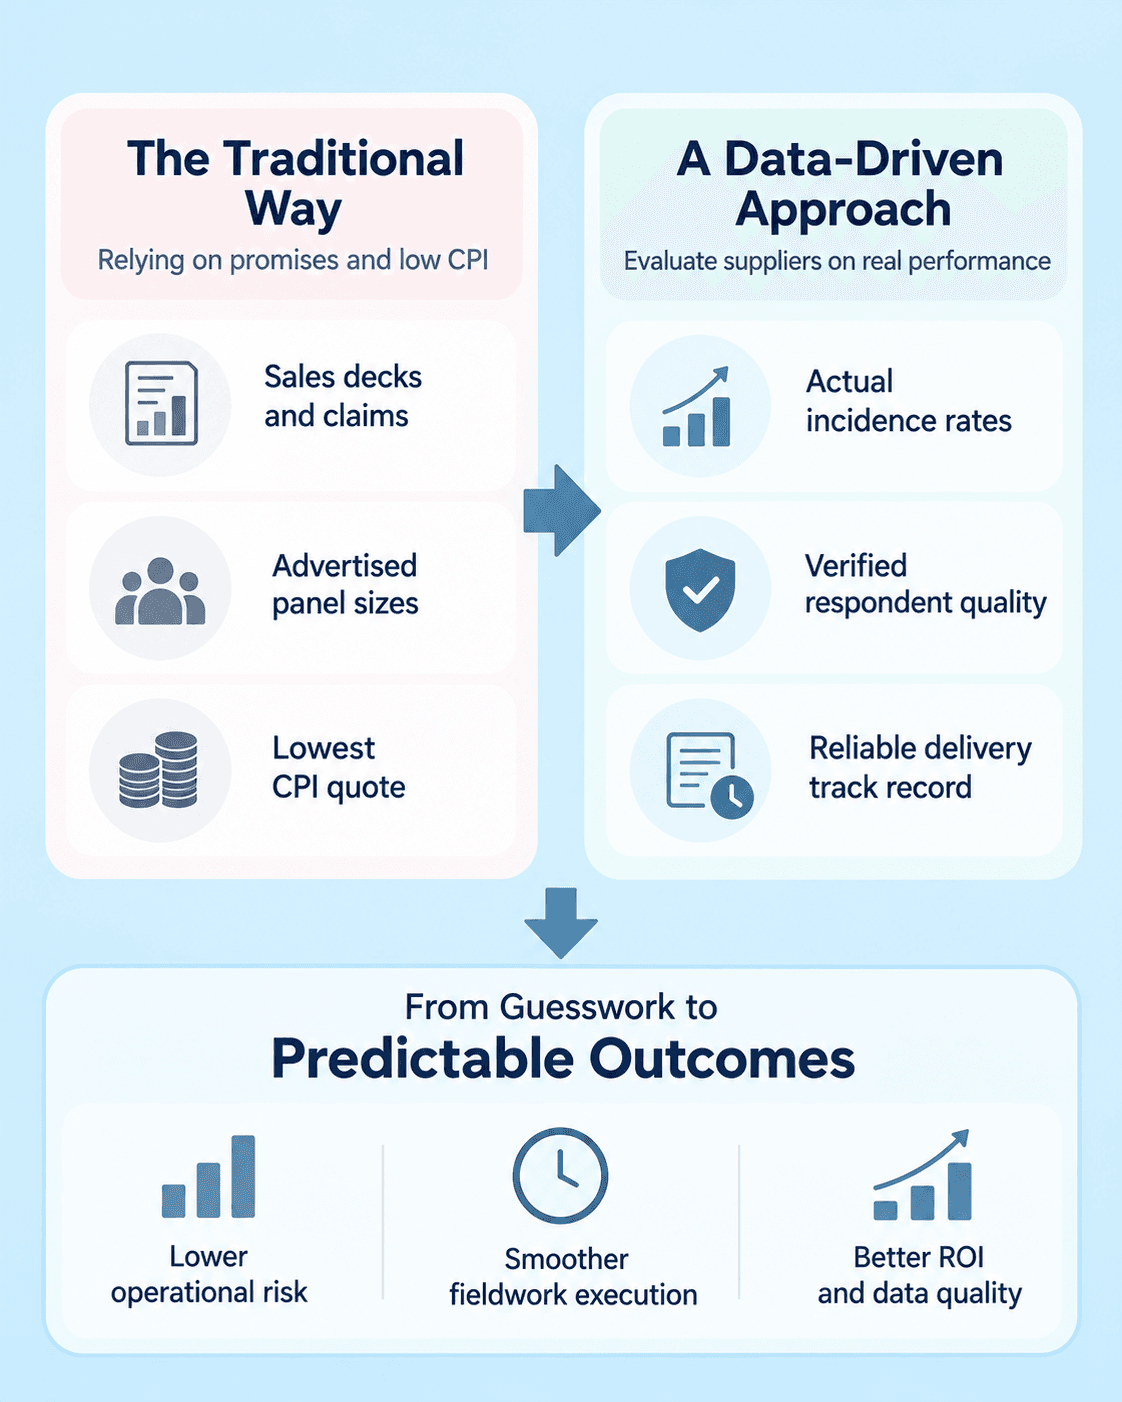
In quantitative market research, buying sample has historically been plagued by severe information asymmetry. When sample procurement teams, research buyers, and operational leads evaluate potential panel partners or sample suppliers, they are frequently forced to rely on sales capability decks, self-reported panel sizes, and headline Cost Per Complete (CPI) quotes.
However, judging a supplier solely on advertised panel counts or initial bid prices inevitably leads to significant operational friction down the line. The sample industry has long operated in a black box where "available panellists" are often double-counted, unengaged, or entirely unreachable when a live project launches. A low quoted CPI quickly becomes a massive financial and operational burden if the supplier's real-world incidence rate falls critically short of expectations, if the respondent quality is fundamentally poor, or if delivery abruptly stalls halfway through fieldwork.
To successfully transition sample procurement from an exercise in guesswork to a highly predictable, data-driven operation, research buyers must fundamentally change how they assess vendors. This requires benchmarking suppliers against concrete, empirical performance metrics rather than relying on promises.
The Shift from Capabilities Decks to Empirical Metrics
For years, sample suppliers competed primarily on sales promises: aggressively claiming millions of active panelists across hundreds of countries and demographic splits. In practice, panel size is a vanity metric. A database of ten million emails is entirely useless if the open rate is zero. What truly matters to a fieldwork manager or research executive is how a supplier performs under actual, real-world project constraints. The core requirement is delivering qualified, highly attentive respondents on time and strictly within budget constraints.
The industry is currently undergoing a necessary evolution from a traditional approach to a metric-driven approach:
- The Traditional Approach: Historically characterized by a heavy reliance on self-reported panel counts, a race to the lowest initial CPI quote, and subjective sales promises made during vendor onboarding. This method leaves buyers entirely blind to the actual field performance until a project is actively failing.
- The Metric-Driven Approach: Defined by tracking Observed Incidence Rate (IR) accuracy, verifying commitment hit rates, actively monitoring in-flight data quality and reversal rates, and calculating the true Total Cost of Ownership (TCO). This approach treats sample procurement as a strict supply chain management exercise.
The 10 Essential Sample Supplier Metrics
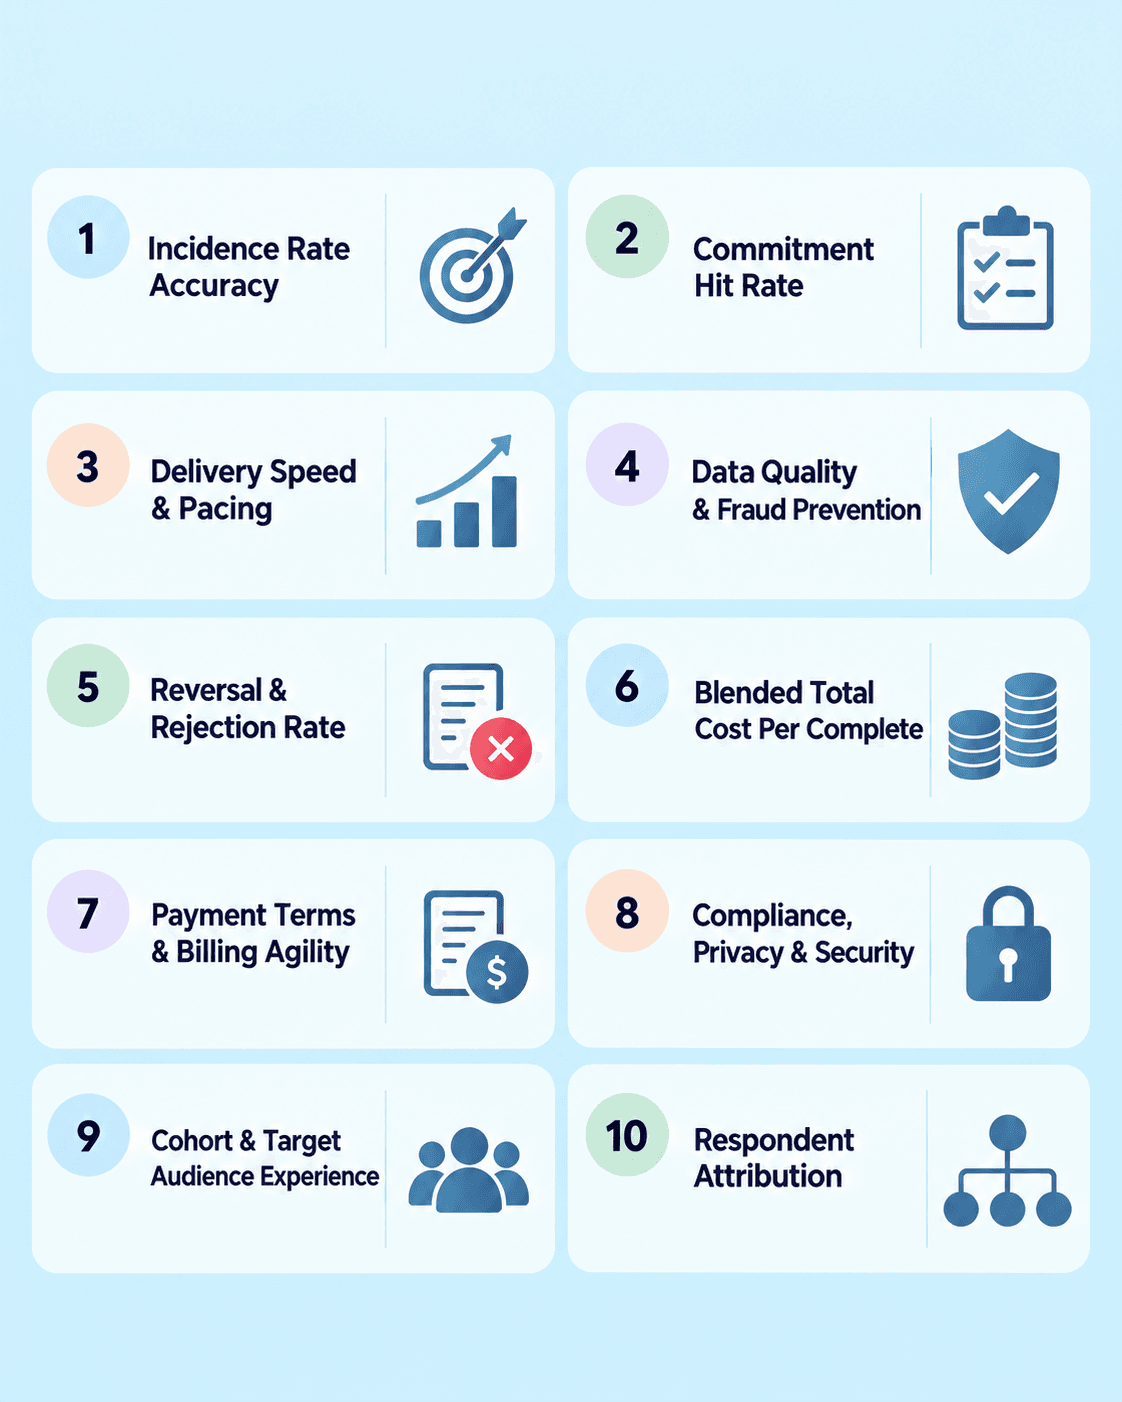
Incidence Rate (IR) Accuracy Rate
The Incidence Rate Accuracy Rate represents the percentage difference between the IR quoted by a vendor during the bidding phase and the actual realized IR achieved during live fieldwork.
- Operational Impact: When a supplier artificially inflates their estimated IR to win a bid, the project is mathematically doomed to miss budget targets. A drop in realized IR inherently requires sending more survey invitations, which triggers mid-field CPI surcharges and delays. By evaluating vendor accuracy on this metric, buyers can identify which partners provide honest feasibility assessments.
- Performance Target: Variance must be contained within ±10%.
Commitment Hit Rate (Delivery Fulfillment)
This metric is defined as the ratio of promised sample volume that is actually delivered within the strictly agreed-upon fieldwork window.
- Operational Impact: A commitment hit rate tracks reliability. If a vendor promises 1,000 completes in 48 hours but delivers only 600, the research agency is forced to urgently scramble for replacement sample, often at exorbitant premium rates, to meet client deadlines.
- Performance Target: Best-in-class suppliers should consistently achieve 95%+ delivered on time.
Delivery Speed & Pacing Curve
Delivery speed is tracked by the distribution rate of completed surveys over time.
- Operational Impact: Fieldwork rarely fails on day one; it fails on day four when the pacing suddenly flatlines. Benchmarking late-stage pacing decay is critical to ensure steady delivery without abrupt drop-offs. A healthy supplier provides a linear, balanced delivery curve rather than burning through their most active panellists in the first two hours and failing to close the final 20% of the quotas.
Data Quality & Fraud Prevention Score
This score represents the proportion of incoming respondents verified as genuine, unique humans prior to survey entry.
- Operational Impact: Bad data corrupts final research insights. Effective fraud prevention requires real-time entry gating (processing in under 16ms) to stop malicious actors before they ever see the first survey question. This protects against sophisticated bot networks, click-farms, and duplicate respondents trying to exploit incentive payouts.
Reversal & Rejection Rate
The reversal rate calculates the percentage of delivered completes that are formally rejected during post-field validation processes.
- Operational Impact: Completes are typically rejected due to speeding, straight-lining (answering in a uniform pattern across matrix questions), or providing gibberish open-ended text failures. High reversal rates indicate a fundamentally disengaged or unvetted panel.
- Performance Target: Rejections should be kept to under 3% for General Population (GenPop) studies and under 5% for specialized B2B audiences.
Blended Total Cost Per Complete (Effective CPI)
This is the true cost per usable complete, calculated by factoring in the base CPI, any operational setup fees, minimum cell charges, and the cost of rejected completes.
- Operational Impact: Focusing on the headline CPI is a critical procurement trap. A $2.00 CPI is actually far more expensive than a $3.00 CPI if 40% of the $2.00 data has to be thrown out and replaced.
- Formula: Effective CPI = [(Quoted CPI × Delivered Completes) + Setup Fees] / Valid Verified Completes
Commercial Payment Terms & Billing Agility
This metric assesses the flexibility of a vendor's payment structures, their invoice matching terms (e.g., Net 30/60), and the clarity of their reconciliation windows.
- Operational Impact: Rigid payment terms, such as requiring heavy prepayments or enforcing unyielding Net 15 limits, put undue cash-flow strain on research agencies. Flexible reconciliation is vital for adjusting invoices based on post-field data quality reversals.
Compliance, Privacy & Security Standards
This evaluates a supplier's strict adherence to international data privacy laws (such as GDPR and CCPA) and formal industry standards (such as ISO 20252 and double opt-in consent protocols).
- Operational Impact: Utilizing non-compliant suppliers exposes research buyers to massive legal liability and reputational damage. Verified sourcing protocols ensure that panel data is legally gathered and managed.
Relevant Cohort & Target Audience Experience
This metric measures verified recent study volume and successful completion metrics within your exact target demographic over the strictly preceding 90 days.
- Operational Impact: A supplier might be excellent at sourcing suburban millennials but terrible at finding IT decision-makers. General claims of "B2B reach" are insufficient; buyers need verified 90-day volume data confirming the vendor's actual activity within the specific cohort required for the upcoming project.
Respondent Attribution & Source Transparency
This requires 100% single-source tracking IDs for every individual respondent entry.
- Operational Impact: The sample industry is heavily intertwined with brokers who blend traffic from multiple unvetted third parties. Source transparency prevents this unvetted broker blending and allows for precise, line-item quality auditing back to the exact origin point of the respondent.
Quick Reference Supplier Evaluation Checklist
Implementing these metrics requires standardizing the evaluation process across all procurement activities. The following matrix establishes clear thresholds for identifying risk and defining best-in-class performance.
| Evaluation Metric | High Risk Target | Acceptable Target | Best-in-Class Target |
|---|---|---|---|
| IR Accuracy | Variance > +25% | Variance ±10% to ±15% | Variance < 5% |
| Commitment Hit Rate | < 80% delivered | 85%–94% delivered | 95%+ delivered on time |
| Delivery Pacing | Severe late decay | Minor pacing slowdown | Linear, balanced delivery |
| Fraud Screening | No pre-entry checks | Basic IP checks | Real-time entry gating |
| Reversal Rate | > 10% rejected | 4%–8% rejected | < 3% rejected |
| CPI Metric | Headline CPI focus | Quoted + Fee comparison | Blended Effective CPI |
| Payment Terms | Prepayment / Net 15 | Net 30 | Net 30/60+ Flexible reconciliation |
| Compliance | Unverified sourcing | Standard privacy policy | ISO 20252 / GDPR / CCPA compliant |
| Target Cohort Depth | General claims | Verified 6-month history | Verified 90-day volume in exact target |
| Attribution | Blended broker pools | Tier-1 vendor pools | 100% unblended source attribution |
Automating Metric Comparison via the SoftSight Open Network
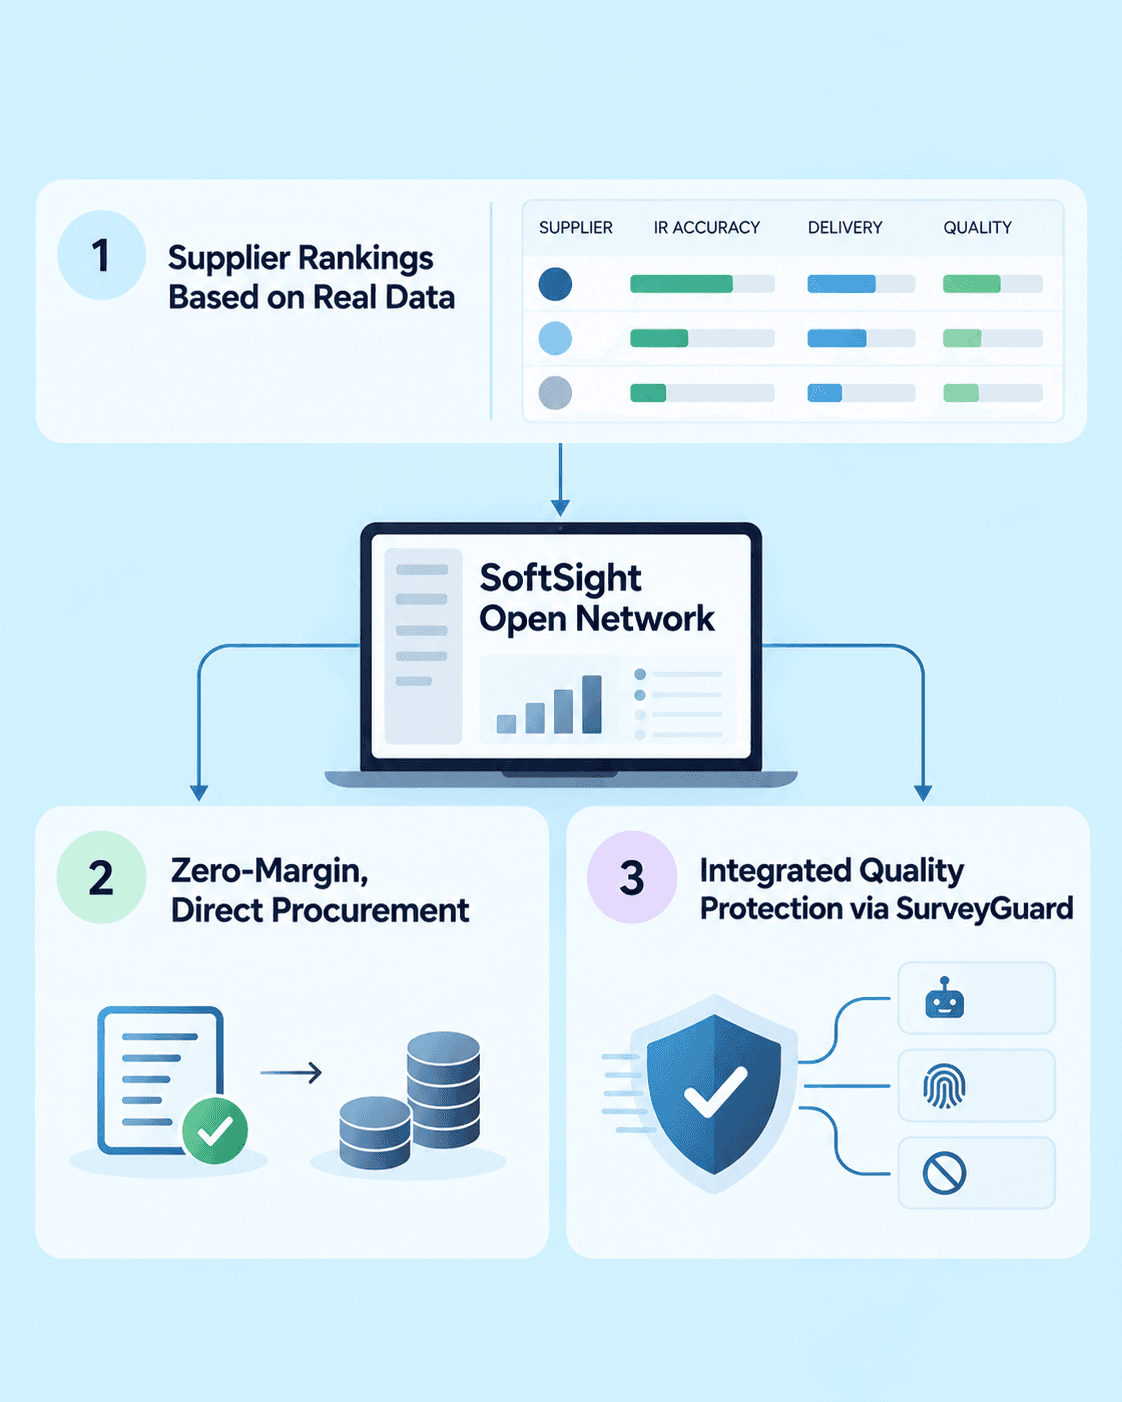
Tracking ten complex metrics manually across dozens of vendors and hundreds of projects is an administrative bottleneck. Modern market research requires systemic automation. SoftSight fundamentally transforms sample procurement through the SoftSight Open Network. This platform operates as an advanced operational software layer and a comprehensive vendor directory that actively surfaces supplier performance metrics strictly based on real, observed fieldwork data.
Standings Based on Observed Performance
Instead of relying on idealized capabilities decks provided by sales representatives, the SoftSight Open Network dynamically ranks sample suppliers based on their actual operational metrics tracked across thousands of live studies. Buyers have instant access to vendor histories regarding Realized IR Accuracy, Commitment Hit Rates, Delivery Velocity, Data Quality Scores, and Billing Compliance, ensuring procurement decisions are rooted in empirical reality.
Zero-Margin, Direct Procurement
Unlike traditional aggregators that mark up CPIs, SoftSight charges zero transaction commissions on sample purchases. Buyers contract directly with named suppliers at their own negotiated rates. This structural approach explicitly preserves vital commercial relationships while guaranteeing 100% transparent respondent attribution, entirely eliminating the opacity of blended broker networks.
Integrated Quality Protection via SurveyGuard
Security must be systemic, not reactive. SoftSight integrates powerful, real-time quality protection directly into the routing infrastructure through SurveyGuard.