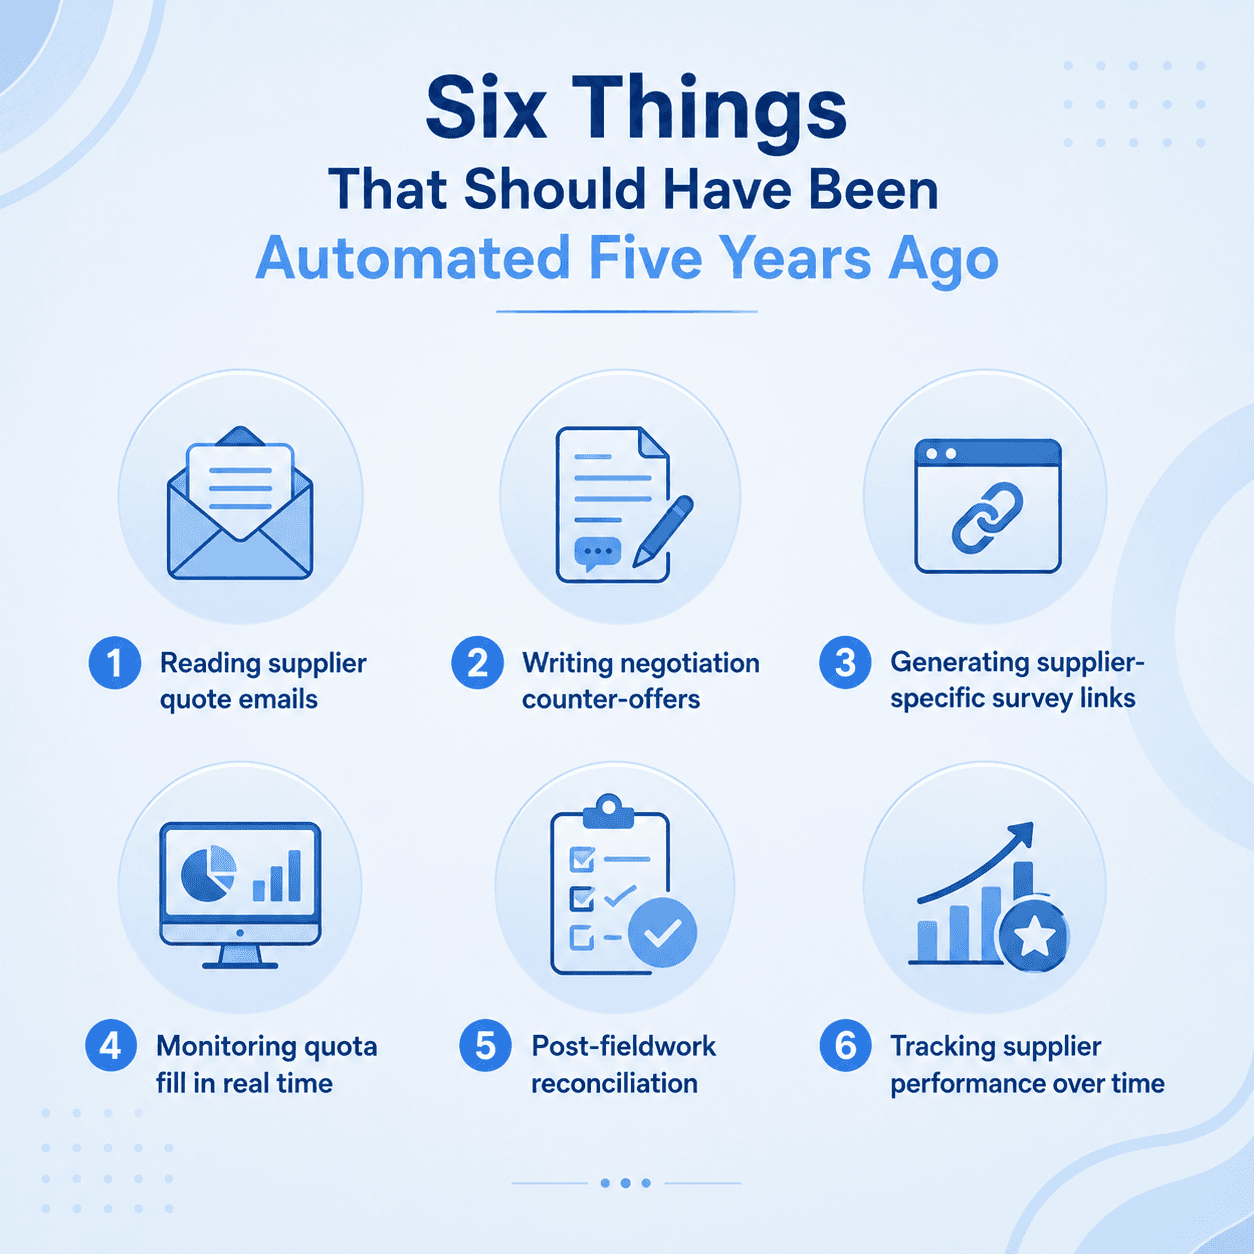
Six Things That Should Have Been Automated Five Years Ago

791 words4 min readOperations Crisis

Corporate infographic titled “Six Things That Should Have Been Automated Five Years Ago,” showing six market research operations tasks: reading supplier quote emails, writing negotiation counter-offers, generating supplier-specific survey links, monitoring quota fill in real time, post-fieldwork reconciliation, and tracking supplier performance over time.
From supplier quotes and negotiation emails to quota monitoring, reconciliation, and supplier performance tracking — too much market research operations work is still being handled manually. The technology exists. The question is: why are we still doing it by hand?

Not every industry moves at the same speed. Some sectors build the operational infrastructure they need almost as fast as they grow. Market research is not one of them. Here are six things that every agency does manually today that should have been automated years ago — and what it costs every time they are not.

1. Reading supplier quote emails
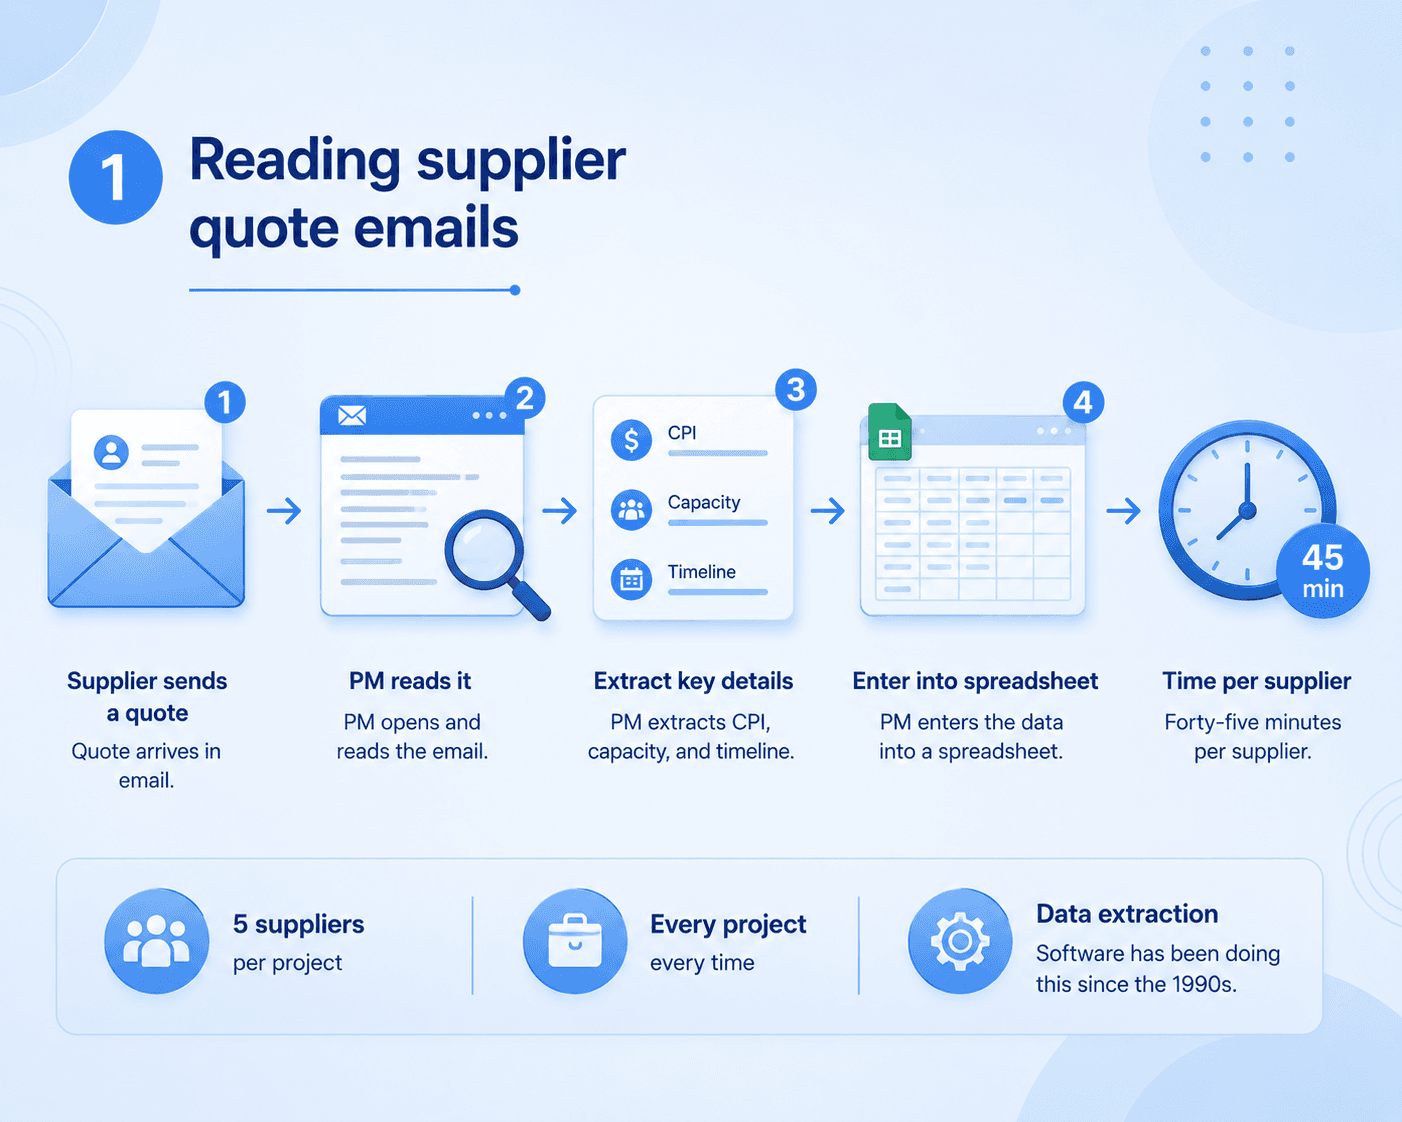
Corporate infographic showing a supplier quote email being reviewed, key details such as CPI, capacity, and timeline being extracted, and entered into a spreadsheet.
Reading supplier quote emails 📩 A supplier sends a quote. A PM reads it, extracts the key details, and enters them into a spreadsheet — repeatedly, project after project. Data extraction shouldn't require manual copy-paste.

A supplier sends a quote. A PM reads it, extracts the CPI, capacity, and timeline, and enters it into a spreadsheet. Forty-five minutes per supplier. Five suppliers per project. Every project, every time. This is data extraction. Software has been doing data extraction since the 1990s.

2. Writing negotiation counter-offers
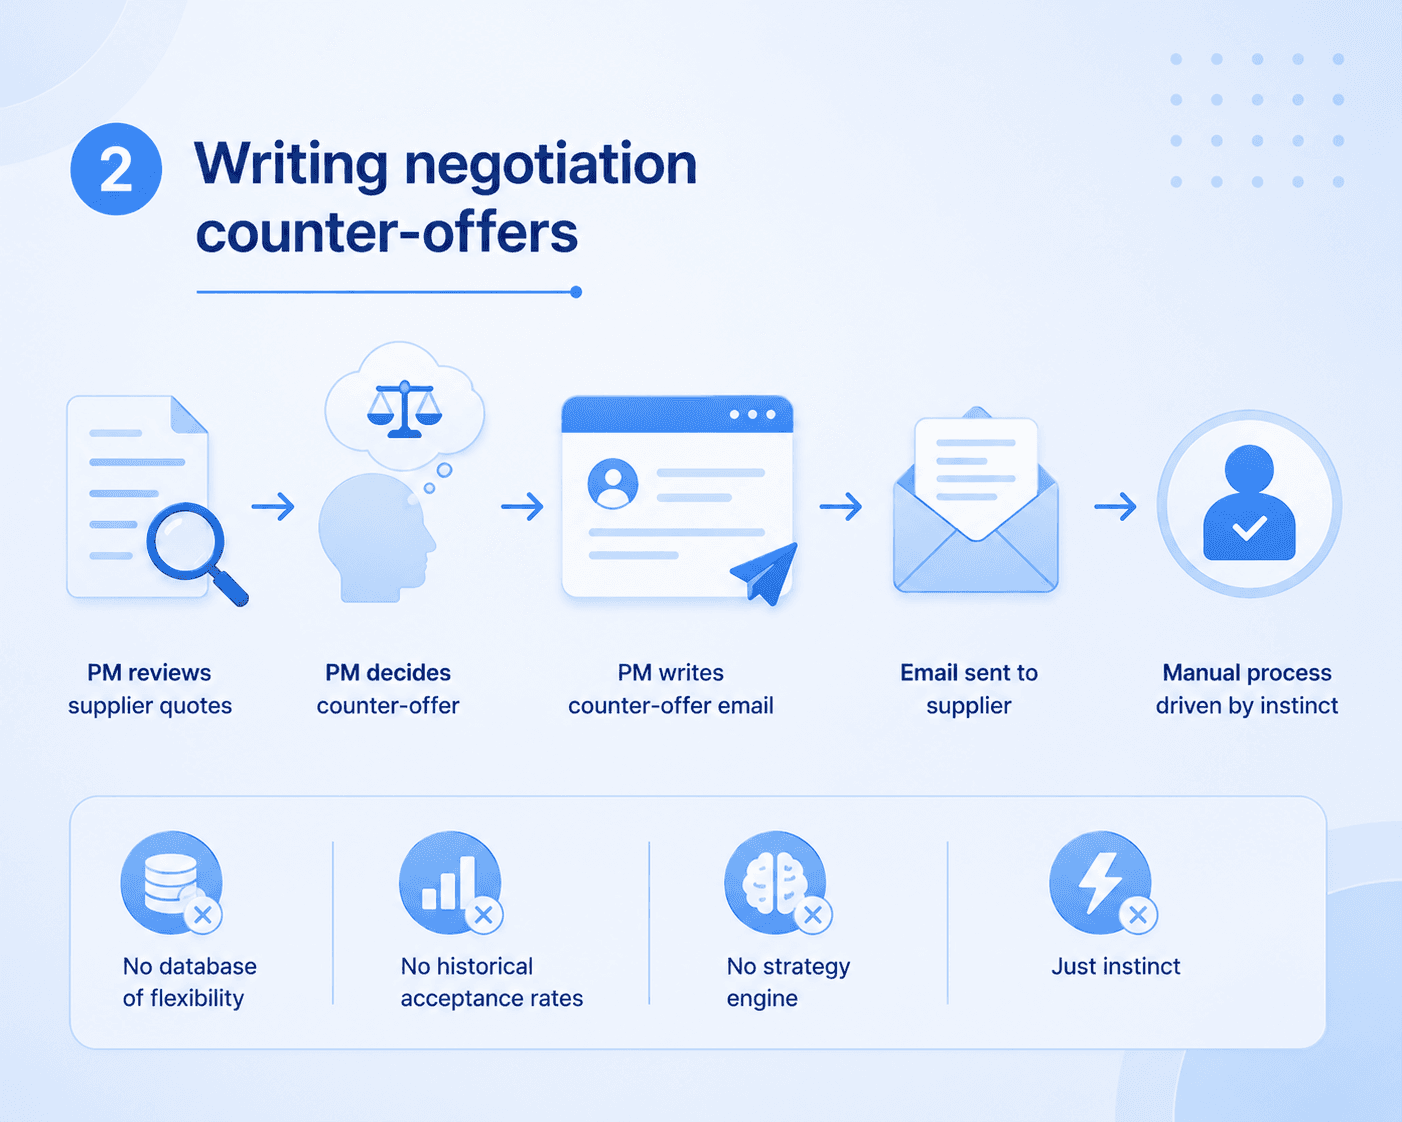
Corporate infographic showing supplier quotes being reviewed, a negotiation counter-offer being prepared, and an email being sent to the supplier, highlighting the lack of historical data or strategy.
Counter-offers are often based on experience, memory, and instinct - rather than supplier history or data. No flexibility database. No acceptance-rate trends. Just guesswork.

After reviewing quotes, a PM writes an email to each supplier with a counter-offer. The counter is based on gut feel, experience, and whatever she can remember about what this supplier accepted last time. There is no database of supplier flexibility. No historical acceptance rates. No strategy engine. Just instinct.

3. Generating supplier-specific survey links
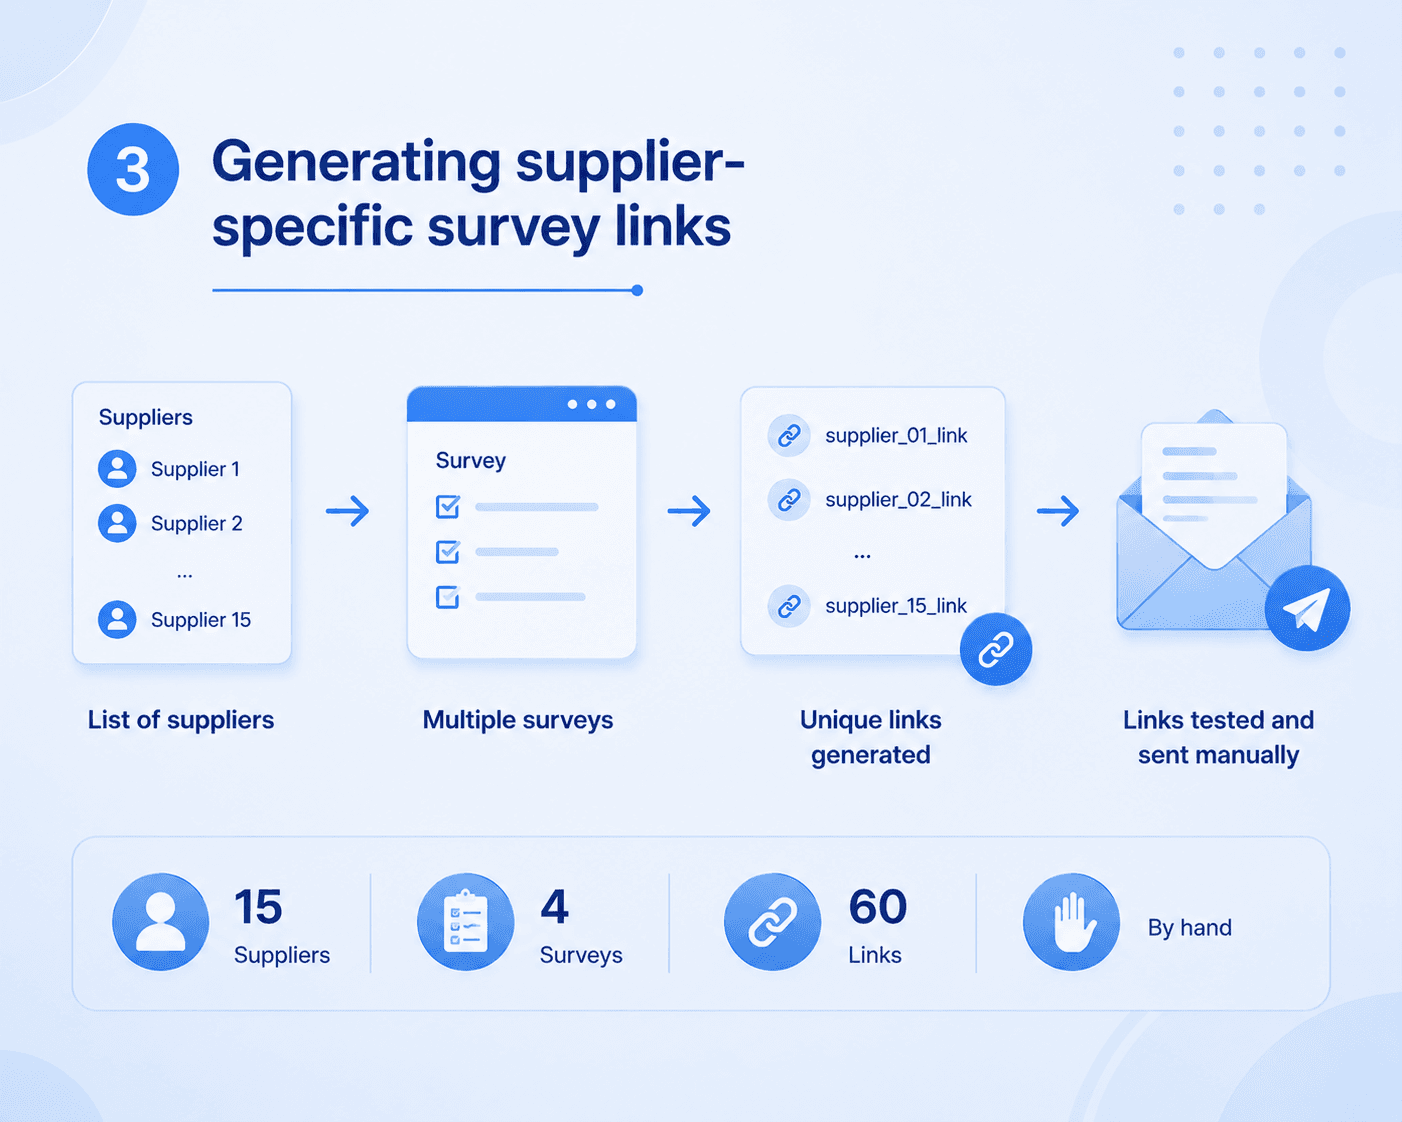
Corporate infographic showing suppliers and surveys being connected to multiple unique survey links that are manually generated, tested, and sent.
15 suppliers. 4 surveys. 60 unique links. Generated, tested, and sent manually. That's a lot of repetitive work for something software should handle automatically.

Every supplier needs a unique survey entry link with their identifier embedded. PMs create these manually, test them manually, and send them manually. For fifteen suppliers across four surveys, that is sixty links. By hand.

4. Monitoring quota fill in real time
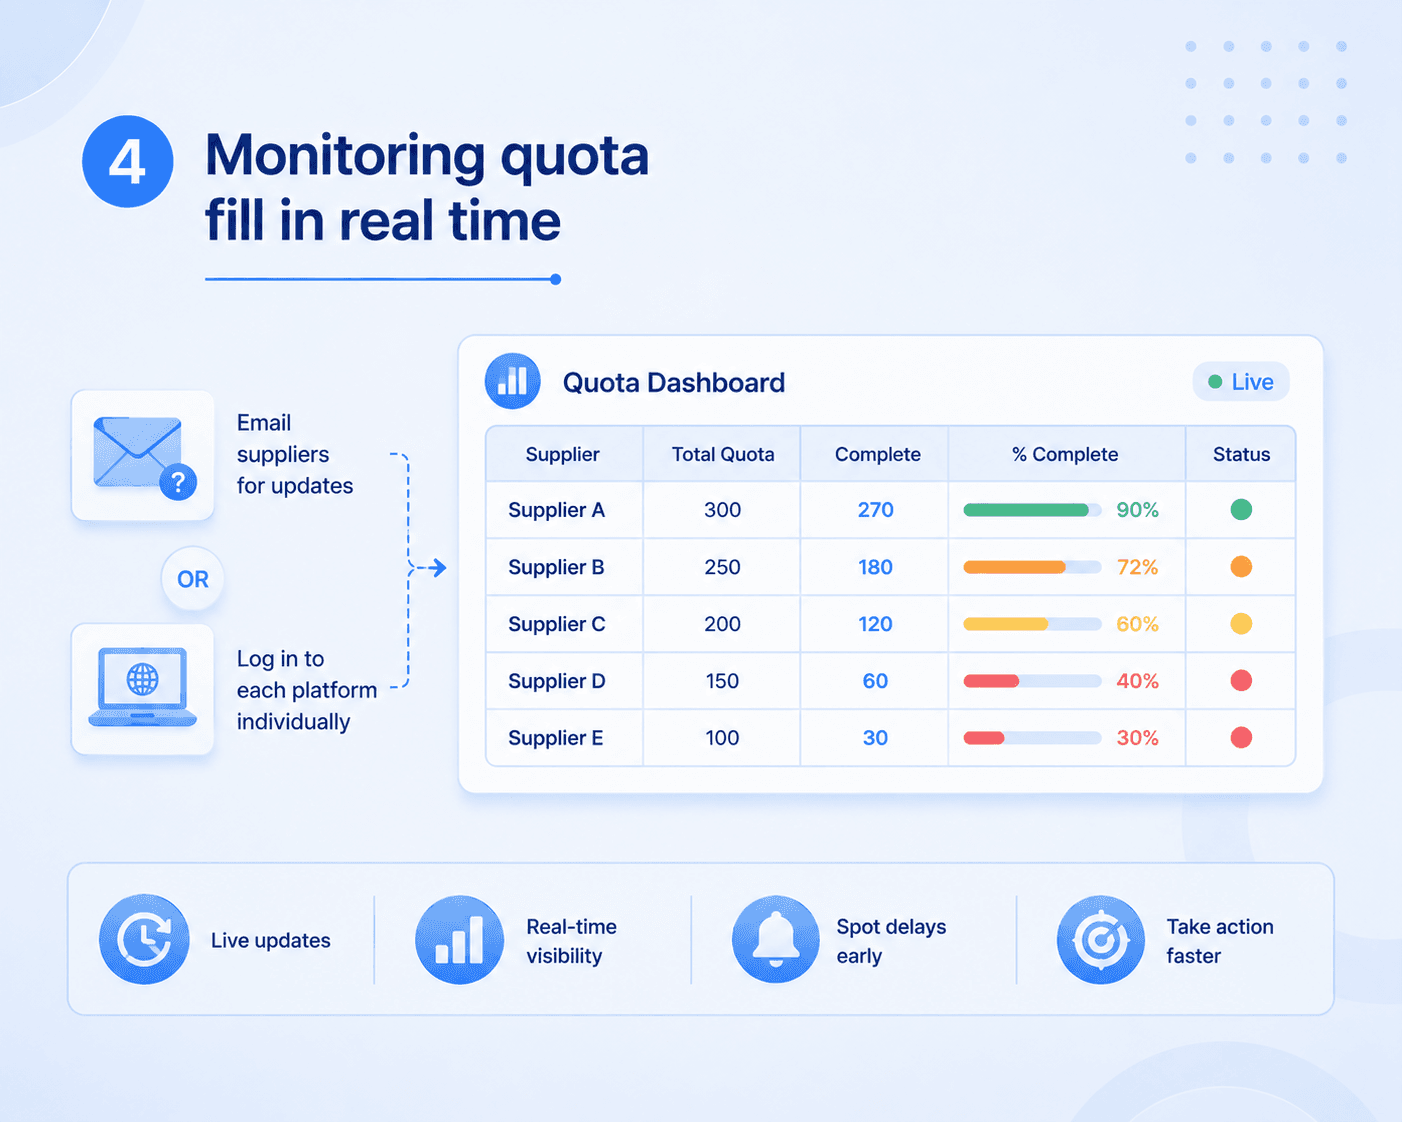
Corporate infographic showing manual supplier updates and multiple survey platforms feeding into a real-time quota dashboard with supplier completion percentages and progress bars.
During live fieldwork, PMs shouldn't have to chase suppliers for updates or log into multiple platforms just to understand quota progress. A live dashboard should make the status visible instantly.

During live fieldwork, quota cells fill at different rates across different suppliers. PMs monitor this by emailing suppliers for updates, or by logging into each survey platform individually and checking completion counts. A live dashboard for this has existed in adjacent industries for decades.

5. Post-fieldwork reconciliation
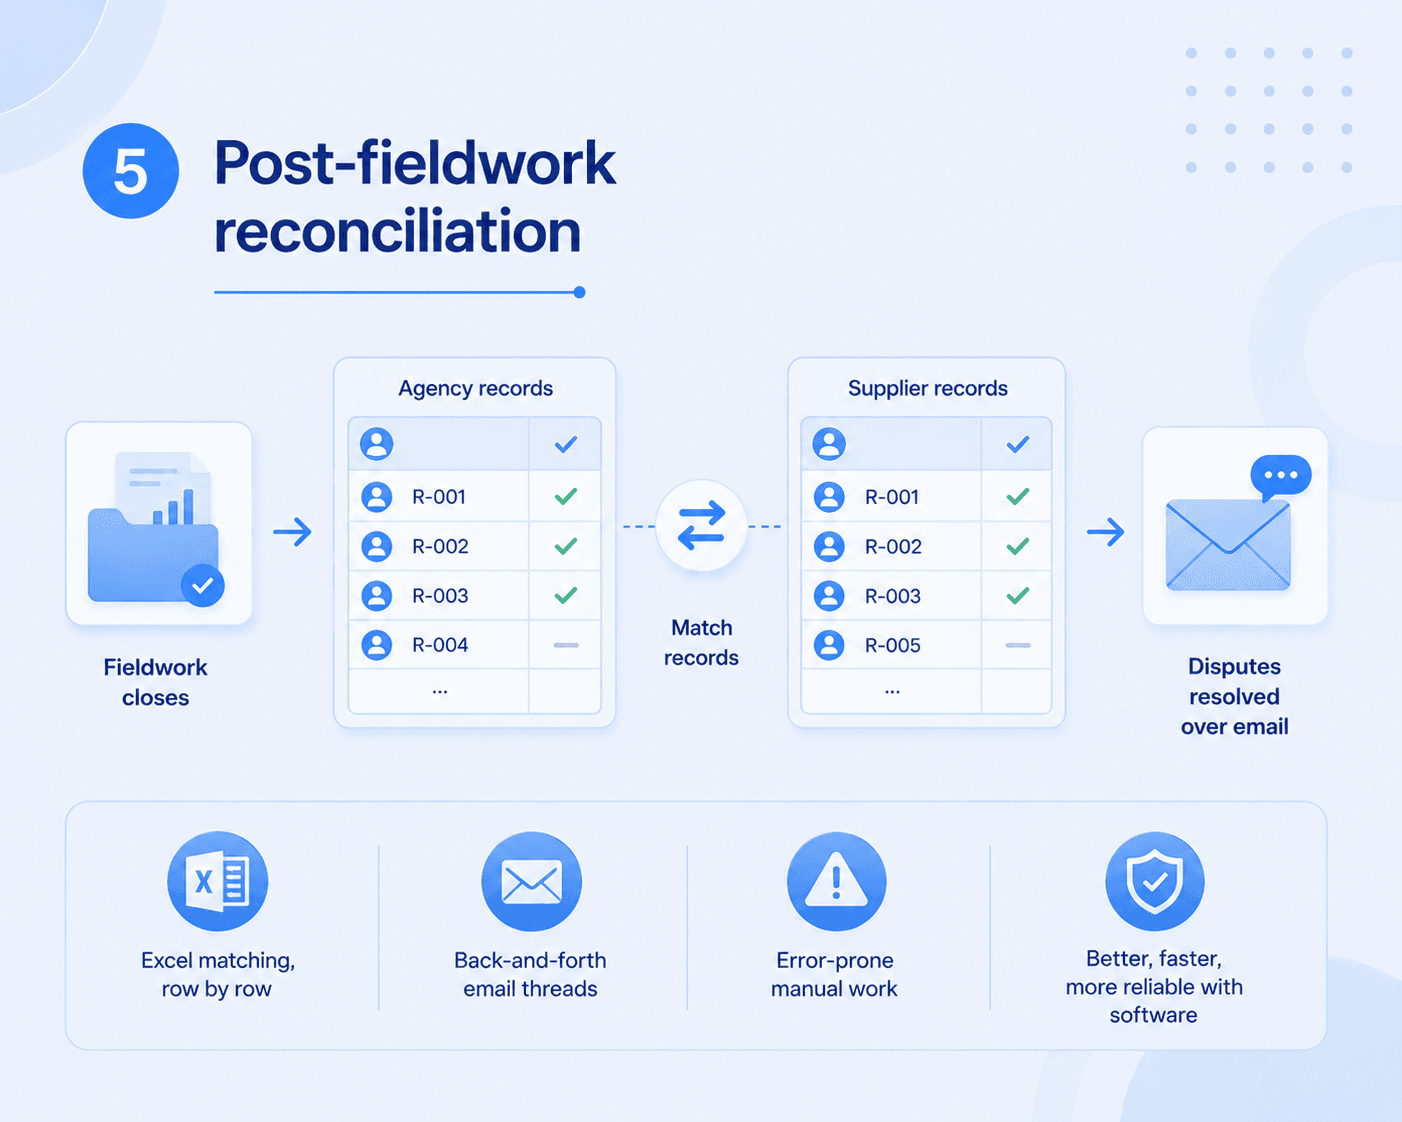
Corporate infographic showing agency and supplier respondent records being matched after fieldwork, with discrepancies resolved through email and manual Excel reconciliation.
Fieldwork closes. Then comes the spreadsheet matching, row-by-row checks, and email threads over discrepancies. It's data matching. Software should be doing the matching — not people.

When fieldwork closes, someone matches the agency's respondent records against the supplier's records to establish how many completions to pay for. This is done in Excel, row by row, with disputes resolved over email. It is pure data matching — exactly the kind of work that is most error-prone when done by humans and most reliable when done by software.

6. Tracking supplier performance over time

Who consistently delivers on time? Which supplier has the highest fraud rate? Which one accepts lower CPIs for B2B studies? Most agencies cannot answer these questions because the data lives in hundreds of individual email threads. No aggregation. No trends. No intelligence.

None of these tasks require human judgment. All of them currently consume human time. The operational infrastructure to automate all six exists. The question is not whether it will happen. It is which agencies will move first.

SoftSight — automates all six. softsight.io
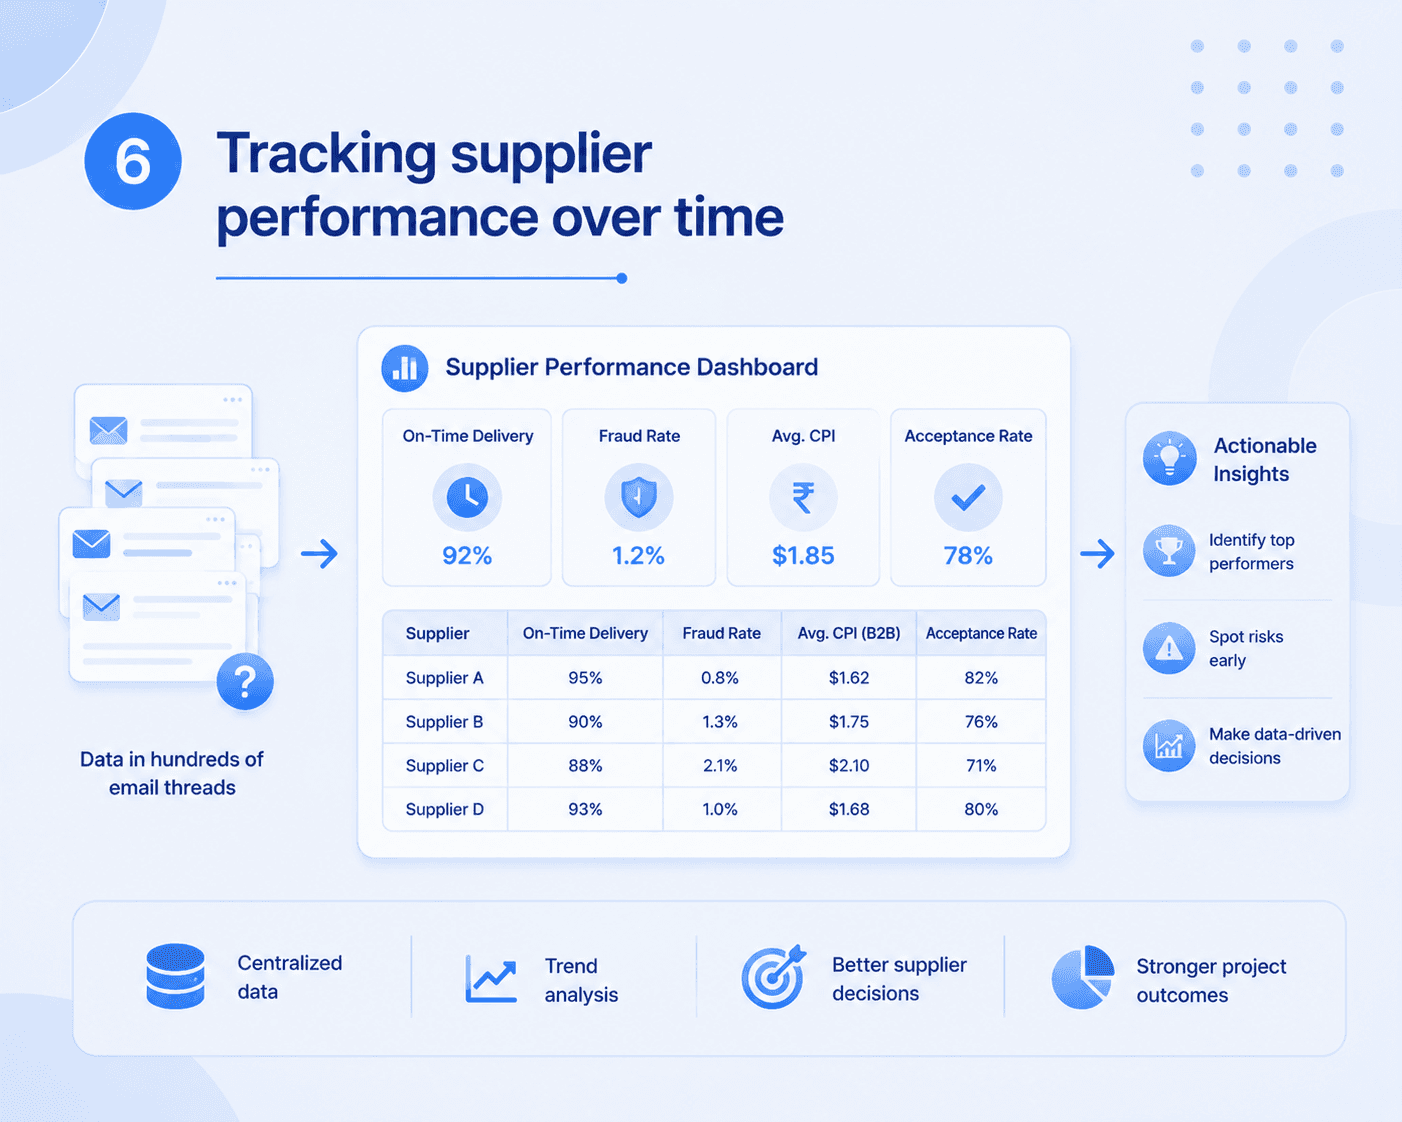
Corporate infographic showing email-based supplier data being transformed into a supplier performance dashboard with metrics for delivery, fraud rate, CPI, and acceptance rate.