If you have spent any time working inside a market research agency or talking to a panel vendor, you have heard the term CPI thrown around like everyone already knows what it means. Most people nod along. A lot of people are quietly guessing. This post is for everyone who wants to actually understand CPI in market research, how it gets calculated, what drives it up or down, and why in 2026 the whole model is finally starting to be rethought from the ground up
So, What Is CPI in Market Research?
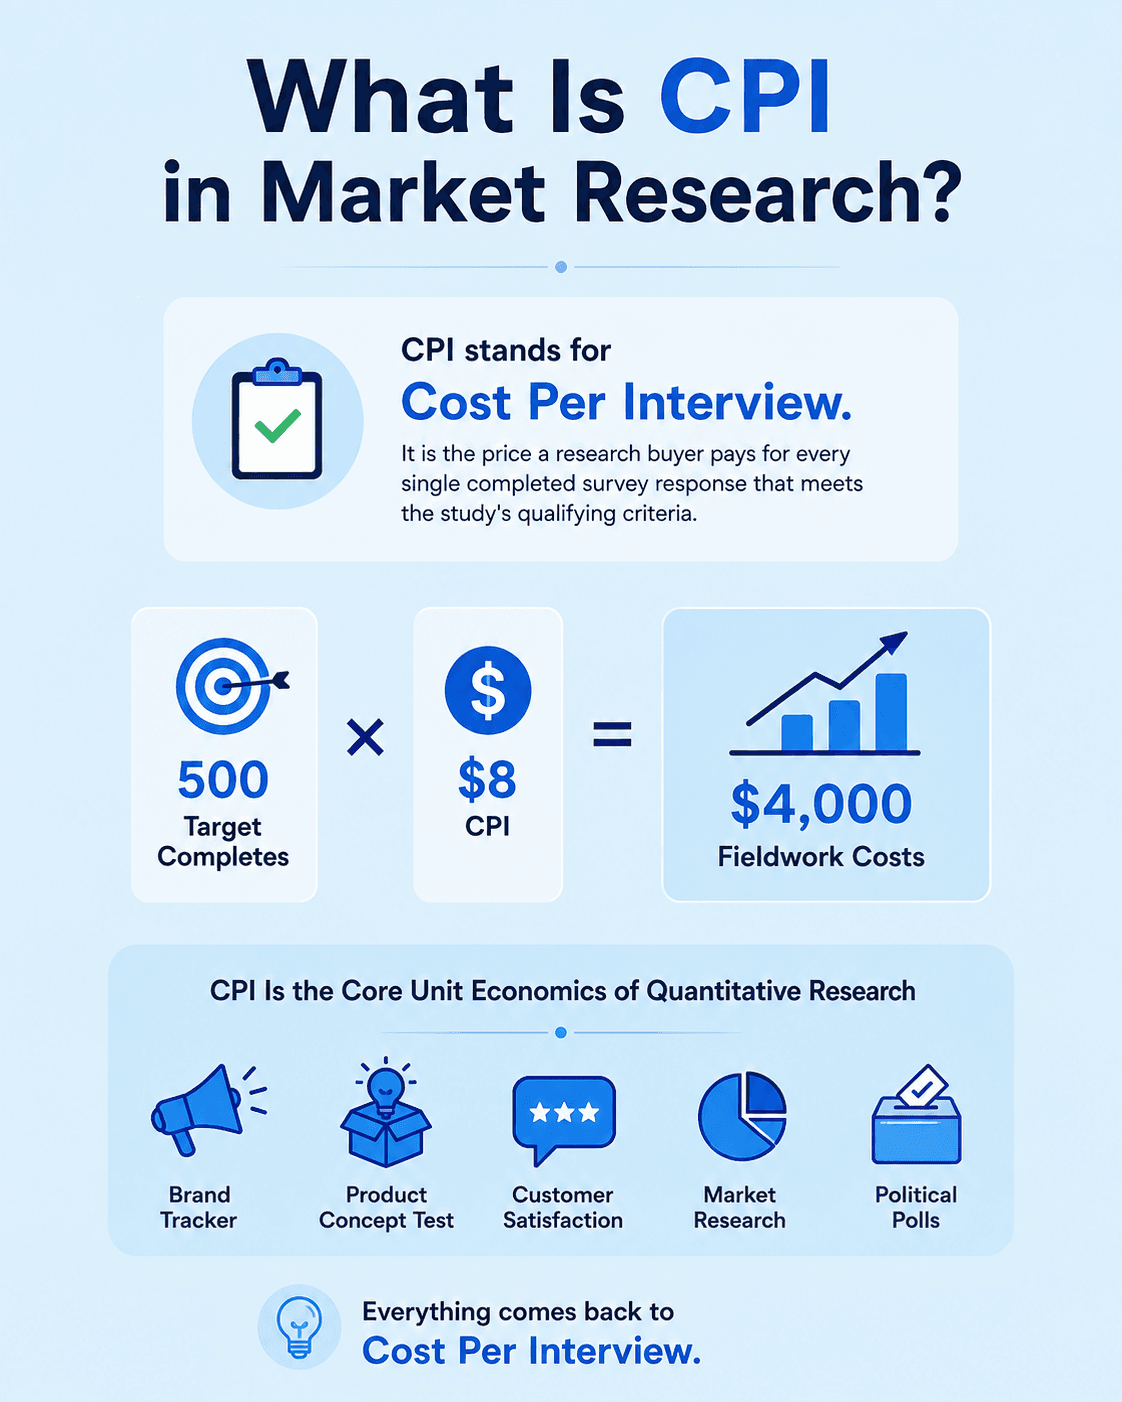
CPI stands for Cost Per Interview. It is the price a research buyer pays for every single completed survey response that meets the study's qualifying criteria. Not clicks. Not starts. Completes.
If you field a study with 500 target completes and your CPI is $8, you are paying $4,000 in fieldwork costs. Simple on paper. Complicated in practice.
CPI is the core unit economics of quantitative research. Whether you are running a brand tracker, a product concept test, a customer satisfaction study, or a political poll, CPI is the number that ultimately determines whether a project is profitable for the supplier and affordable for the buyer. Everything else, the questionnaire design, the sample source, the timelines, eventually comes back to what you are paying per completed interview.
Breaking Down the CPI Formula
Here is where most explainers get lazy. They say CPI equals cost divided by completes and call it a day. That is not wrong, but it does not tell you anything useful.
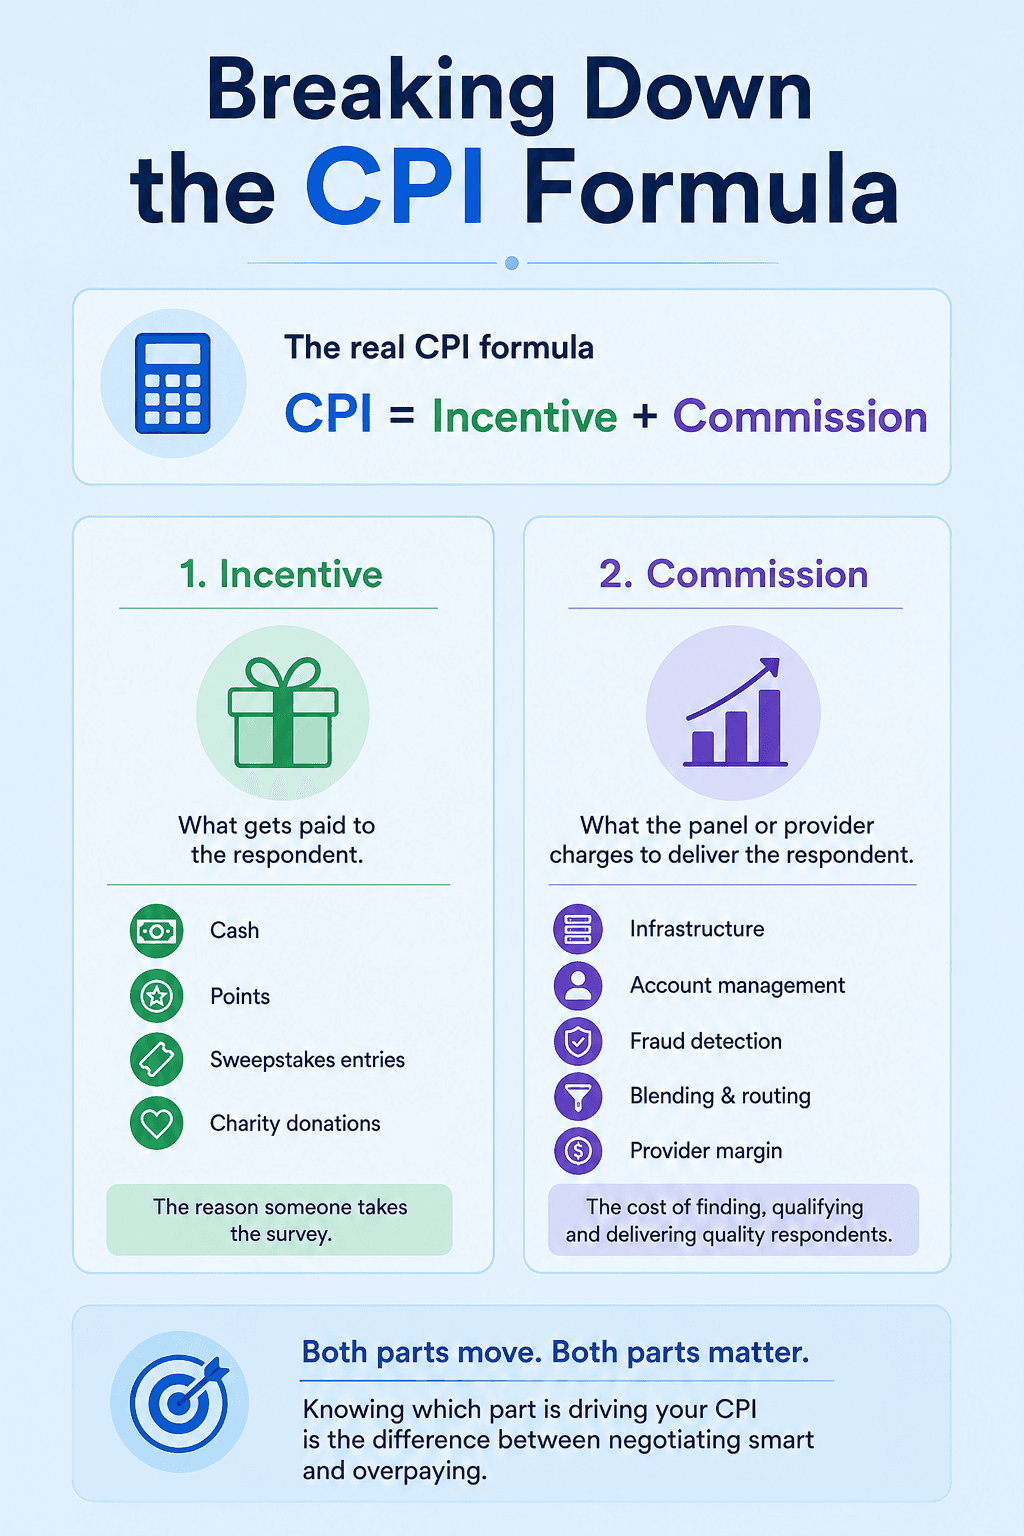
The more honest way to understand CPI in market research is to break it into its two real components: incentive and commission
Incentive is what actually gets paid to the respondent. It is the reason someone sits down and spends 12 minutes of their Friday evening answering questions about detergent or healthcare or B2B software. Incentives can be cash, points, sweepstakes entries, or charity donations depending on the panel. But the incentive is a real cost that flows to a real person at the end of the survey.
Commission is what the panel company or sample provider charges on top of that to actually find, qualify, route, and deliver that respondent. This covers their infrastructure, their account management, their fraud detection, their blending logic across multiple sources, and of course their margin.
So the actual CPI structure looks like this:
| CPI = Incentive + Commission |
|---|
Both parts move. Both parts matter. Understanding which one is inflating your CPI on a given project is the difference between a buyer who can negotiate and one who just accepts whatever the vendor quotes.
The Factors That Drive CPI Up or Down
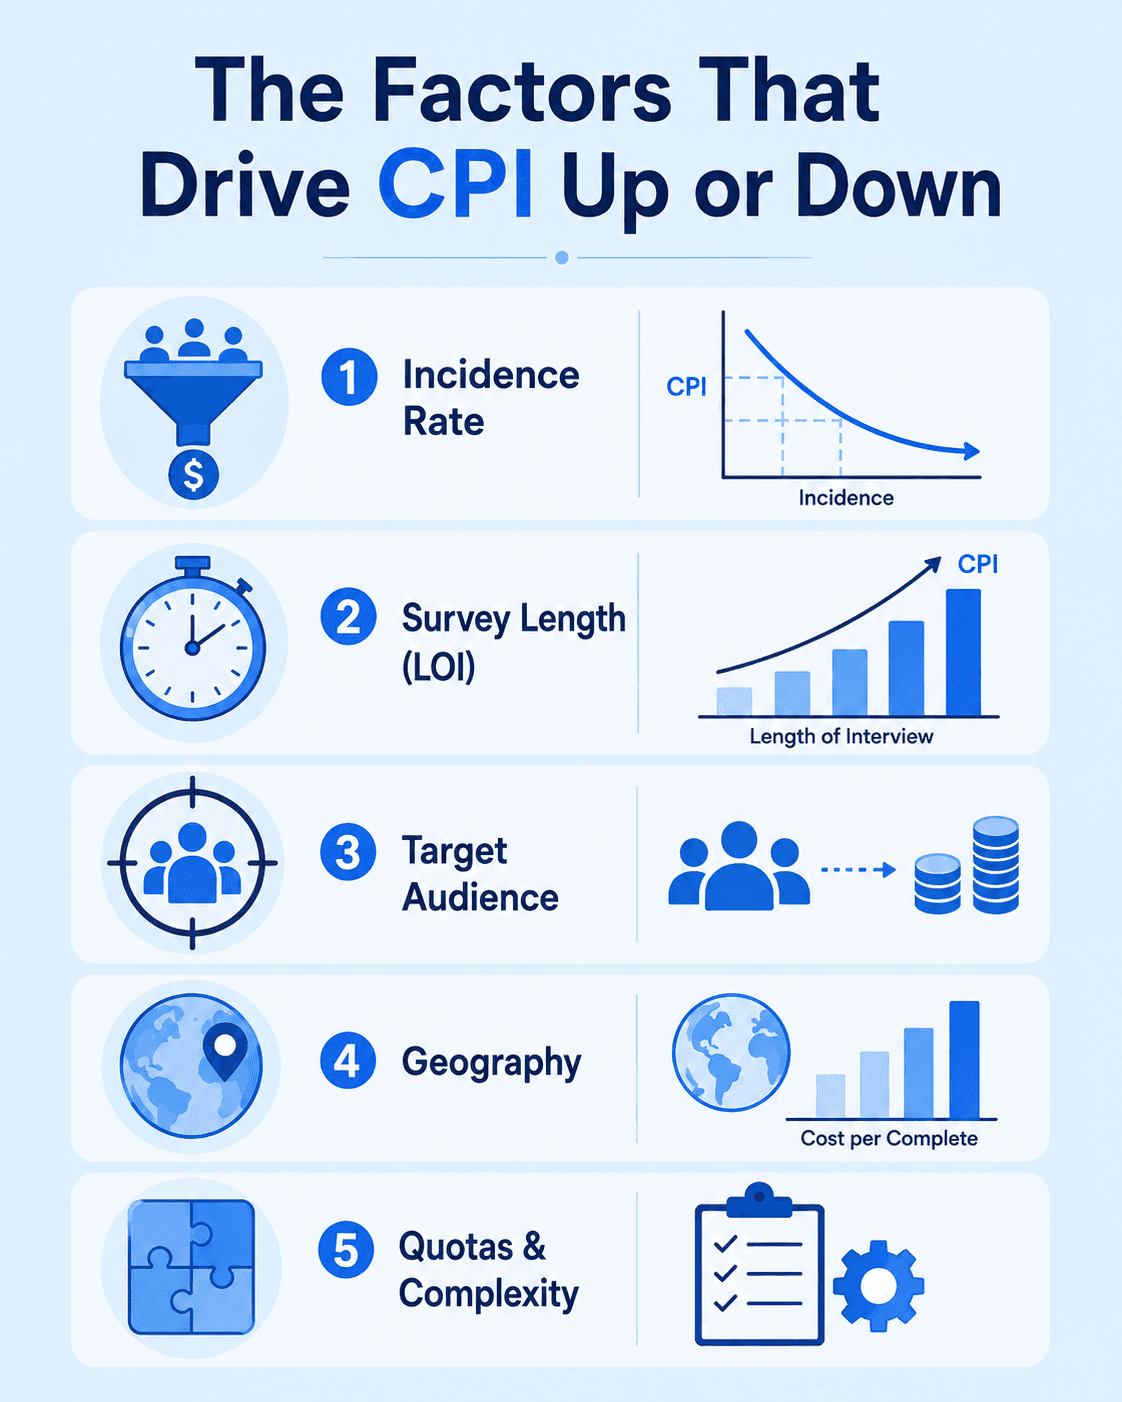
CPI in market research is not a fixed rate. It is a dynamic output of multiple variables colliding at the same time. Here are the ones that carry the most weight.
Incidence Rate
Incidence rate is probably the single biggest driver of CPI variation. Incidence is the percentage of the general population that actually qualifies for your study. If you are studying adults 18 and over, your incidence might be close to 100%. If you are studying female finance directors at mid-market companies who have evaluated new software in the last 60 days, your incidence might be 3%.
Low incidence means the panel has to push your survey to a lot more people just to land one complete. More screenouts mean more wasted incentive spend. The commission goes up to compensate. CPI climbs fast
The rough industry relationship looks like this: cut incidence in half, and CPI roughly doubles. Not always, but often enough to treat it as a baseline assumption.
Survey Length and LOI
LOI is Length of Interview. Every extra minute you ask of a respondent costs money. A 5-minute survey and a 25-minute survey are not priced the same, and they should not be. Respondent drop-off increases with length, which means the panel needs to recruit harder and retain more to hit your complete target. That effort has a price.
In 2026, with respondent attention getting shorter and panel fatigue being a real documented problem, LOI sensitivity has gone up. Buyers who used to casually build 20-minute questionnaires are now feeling that choice directly in their CPI.
Target Audience
General population is cheap. Niche B2B or specialist healthcare audiences are expensive. This is just supply and demand operating normally. If your target audience is IT decision-makers at companies with over 1,000 employees in the DACH region, the pool of qualifying panelists is small, the incentive needed to recruit them is higher, and the commission to access them is higher too.
Hard-to-reach audiences also tend to have lower panel penetration, meaning suppliers often have to go off-panel or blend multiple sources to hit your numbers. Blending costs more. CPI reflects that.
Geography
Research in the US, UK, Germany, and Australia is typically priced lower than research in emerging markets. This sounds counterintuitive because respondent incentives in emerging markets are nominally lower. But infrastructure costs, panel quality constraints, fraud mitigation requirements, and lower panel density in smaller markets mean the operational cost per complete often stays high or goes higher.
In 2026, the push to do global studies with consistent methodology is running directly into this reality. CPI can vary by a factor of 3 or 4 across geographies for the same study design. Ignoring that in budget planning is how projects blow up.
Quotas and Complexity
A study with no quotas is cheaper than a study with 12 interlocking cells. When you start asking for 50 completes among men aged 35 to 44 in rural areas who own a pet and have purchased a specific product category in the last 30 days, you are not just describing a target audience. You are creating a routing and fulfillment puzzle that takes real operational effort to solve
Complex quota structures increase the effective incidence problem, slow down fielding, and raise the commission component of CPI because someone somewhere is actively managing the routing to balance the cells.
How Automation and AI Are Starting to Change the CPI Equation
For most of the last 20 years, CPI in market research was priced on instinct. An experienced operations person would look at a study spec, think about their panel inventory, run some quick mental math on expected incidence and LOI, and give a number. Sometimes that number was right. Sometimes it was optimistic. Sometimes it was so conservative that the agency lost the bid.
That guesswork is starting to give way to something more precise.
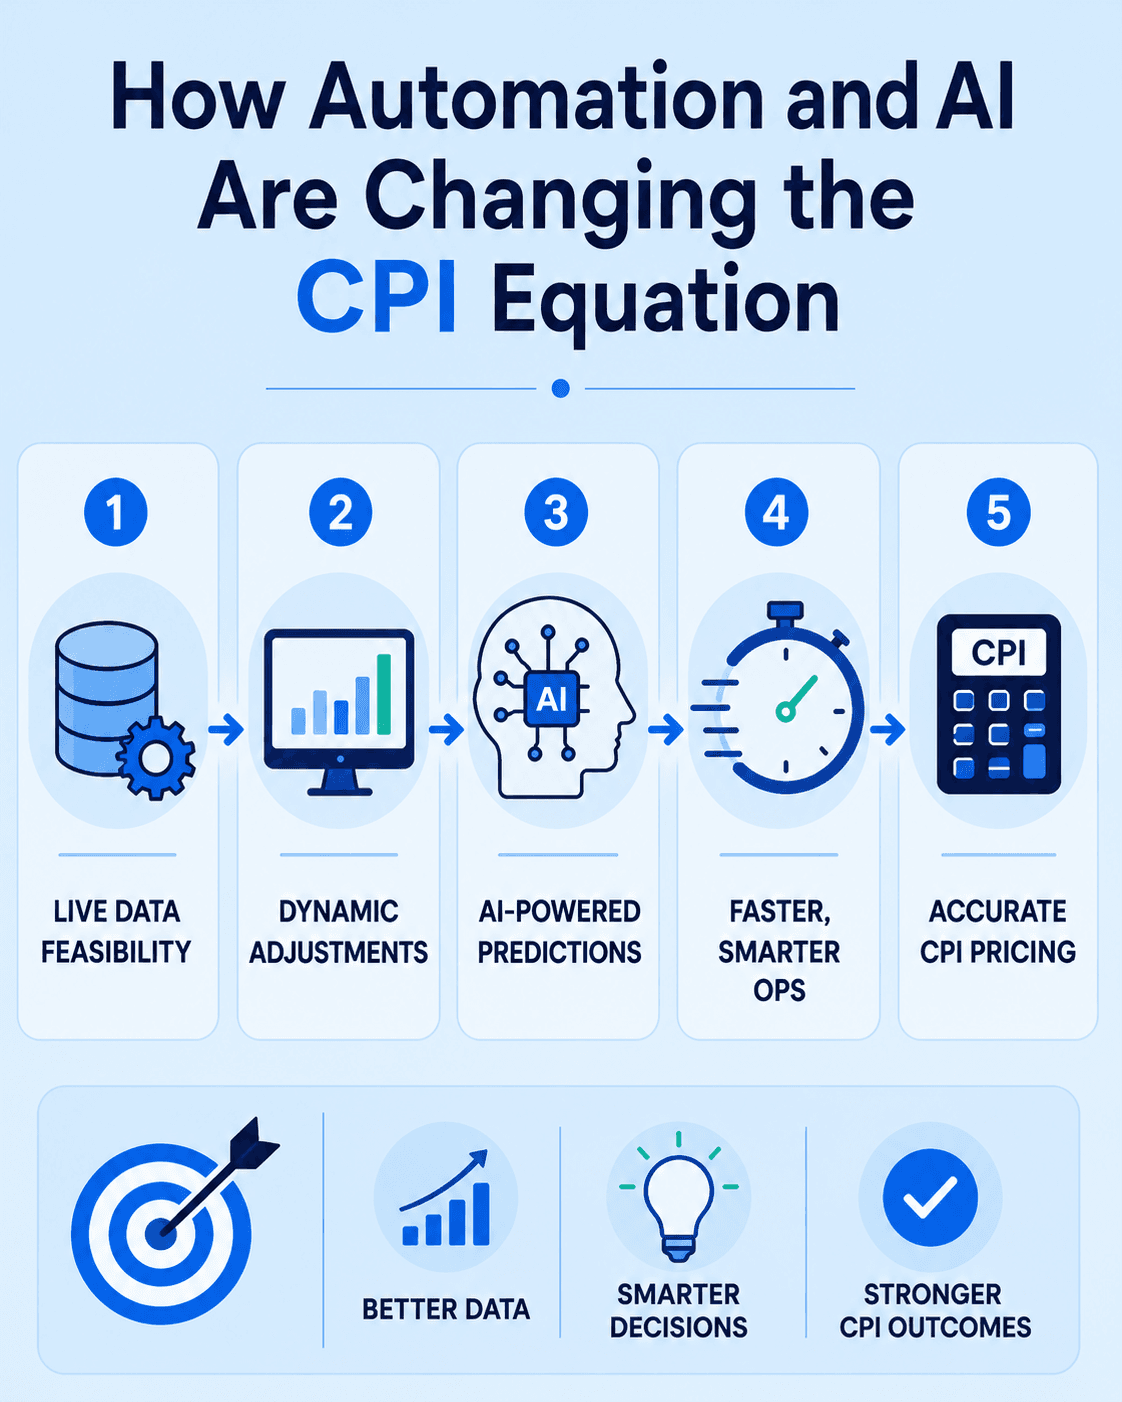
Automated feasibility systems now pull live data across panel sources to estimate how many qualifying respondents exist in a given geography, at a given incidence, for a given LOI, right now. Not based on what fielded last quarter. Based on current inventory.
That shift has a direct effect on CPI.
When a system can see in real time that a particular cell is running thin, it can adjust routing dynamically, either by opening up additional panel sources, modifying incentive levels to improve recruitment, or flagging the issue before the project even launches. What used to take a day of back-and-forth between operations and the panel vendor can now happen in minutes, sometimes seconds.
AI takes this further. Machine learning models trained on historical fielding data can now predict completion rates, dropout points, and fraud risk at the respondent level before a single survey link gets sent. If the model sees that a certain respondent profile has a 70% dropout rate at the 8-minute mark in surveys like this one, it can factor that into the feasibility estimate before you commit to a CPI.
The practical outcome for buyers is more accurate quotes, fewer mid-field surprises, and CPI numbers that are grounded in actual supply reality rather than a vendor's best guess. For suppliers, it means tighter margin control and the ability to price harder audiences more accurately without inflating the quote just to cover uncertainty.
In 2026, the agencies and platforms leaning into this kind of automated, AI-assisted feasibility are starting to separate themselves from those still running ops on spreadsheets and phone calls.
The CPI you quote is only as good as the feasibility data behind it. When that data is live, dynamic, and machine-assisted, the whole pricing conversation changes.
Automated routing and real-time feasibility pricing are not just operational upgrades. They directly compress the uncertainty buffer that inflates CPI on complex projects. To see how to put this into practice quickly without a full platform overhaul, see Priority Quick Win #14, which walks through the highest-leverage changes operations teams can make right now to improve CPI accuracy and fielding speed.
“SoftSight helps market research teams get sharper on fieldwork operations. If your current CPI model still runs on gut feel and retrospective data, it might be time to have a different conversation.”